
File:NasalGC-Relationship-between-GC-and-Stuttering.png
Size of this preview: 800 × 391 pixels. Other resolution: 1,596 × 780 pixels.
Original file (1,596 × 780 pixels, file size: 71 KB, MIME type: image/png)
Summary
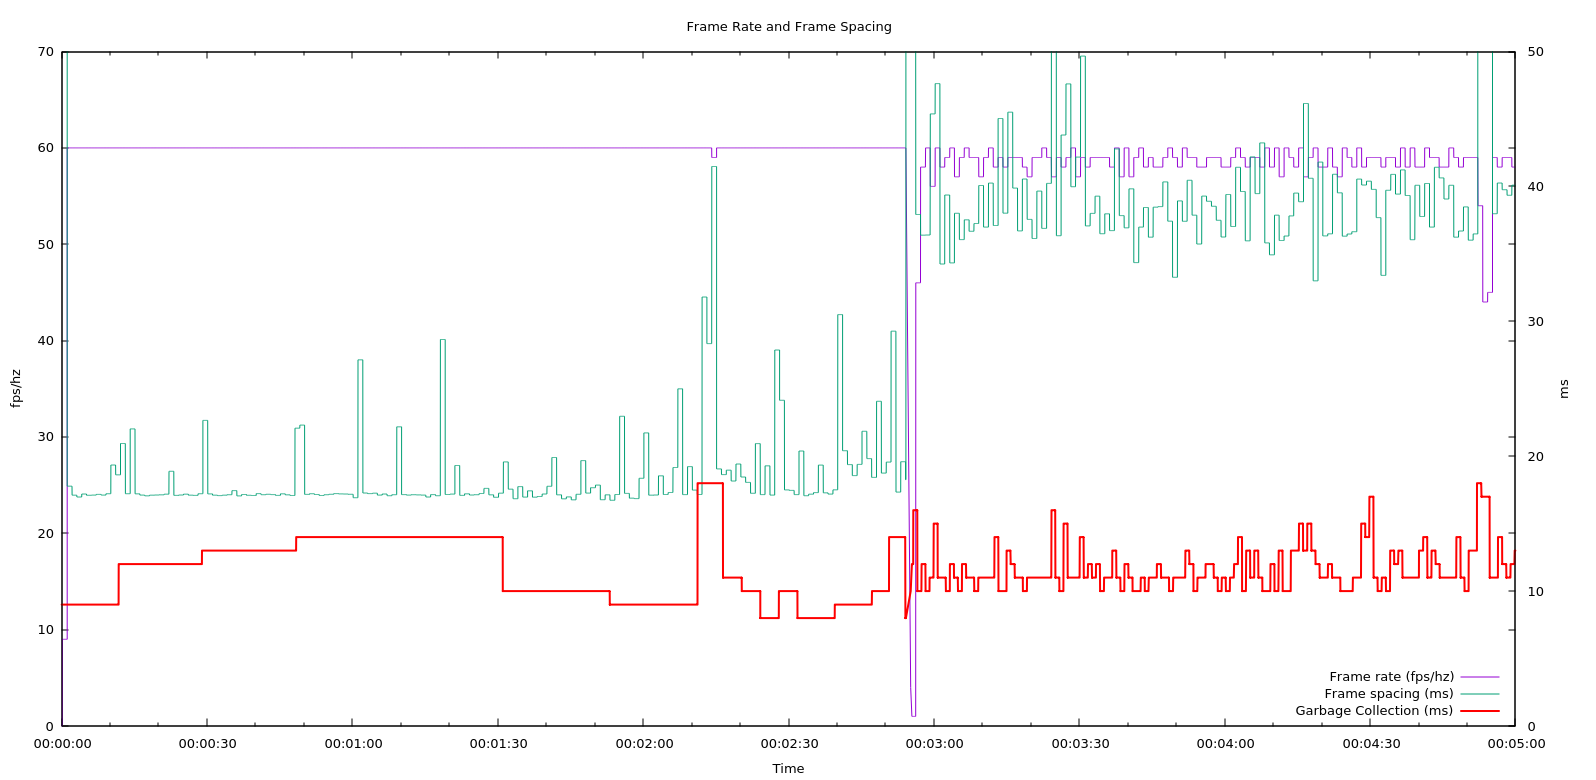
| Description | (en) Screen shot showing a diagram created with gnuplot to visualize the relationship between frame rate, frame spacing and GC induced pauses (exemplified by opening the FG1000 at ~ 03:00) - this causes a ton of GC pressure, and ends up running the GC more frequently than before |
| Date | 1 January 2023 |
| Source | Own work |
| Author | Hooray |
Licensing
|


File history
Click on a date/time to view the file as it appeared at that time.
| Date/Time | Thumbnail | Dimensions | User | Comment | |
|---|---|---|---|---|---|
| current | 10:42, 22 January 2023 | | 1,596 × 780 (71 KB) | Hooray (talk | contribs) | Uploaded own work with UploadWizard |
You cannot overwrite this file.
File usage
The following 2 pages use this file:
